DATA WALKING WORKSHOP
INTRODUCTION
You will work together in small teams. You will walk the area (street or neighbourhood) through the eyes of a data anthropologist. And you will try to collect useful data about your theme during the walk.
Data collection will take place through notes (pen and paper), pictures (mobile phones), digital counting (via app or sensors/arduino), and/or another method you devise. After the walks you will examine the data and how to visualise it in different forms and materials.
This might be your first moment working with data, or you might be very experienced. You might be interested in particular issues, or a technical aspect. As a group remember to accommodate the different experience and skill levels you each have, common and differing interests, and take this as an opportunity to learn from and with one another.
Data Walking is a framework for people to engage with their surroundings and produce visual responses initiated by first hand data enquiry. For this workshop you must maintain an open, inquisitive, and scientific mind; with a willingness to experiment with how to gather data and how to visualise data.
TOOLS & MATERIALS
Arduino with GPS shield and sensors
Smartphones with GPS camera, video, audio recorder
Pen, pencils, or any mark-making tools & paper
Playdough & modelling clay
Threads
Printers
Screens
Software
Mixed analog/digital
VISUAL REFERENCES
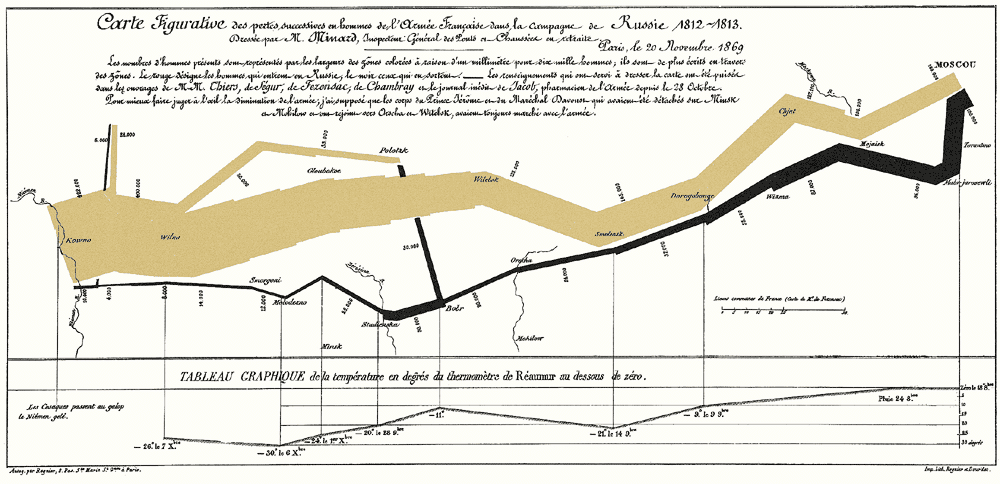
Napolean's Retreat — Joseph Charles Minard
Phantom Terrain — Stefanie Posavec, Frank Swain, Daniel Jones
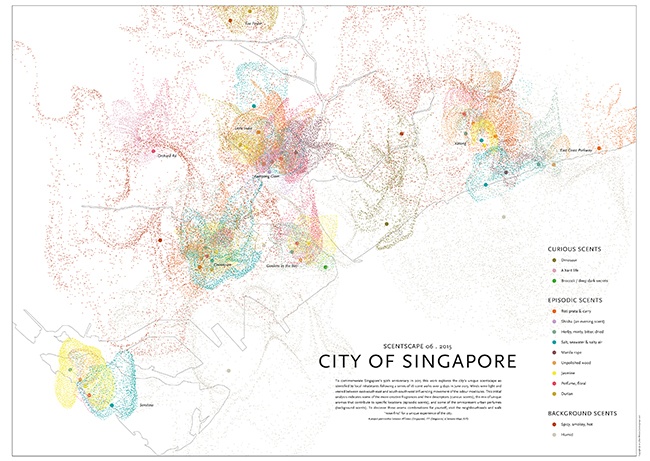
Smell Maps — Kate McLean
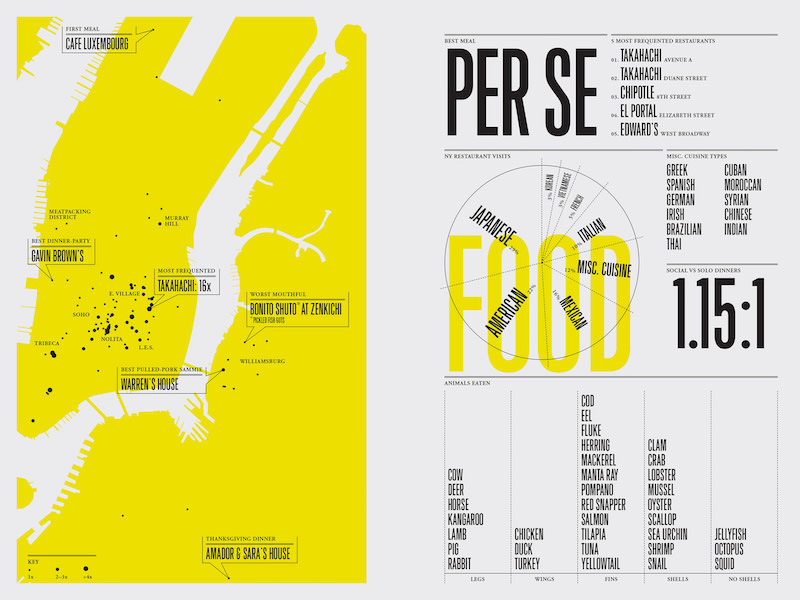
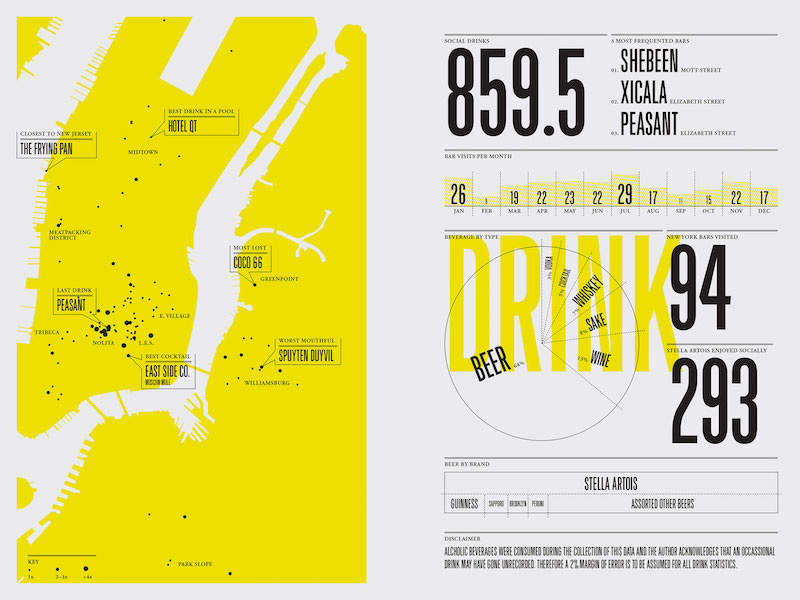
Feltron — Nicholas Felton
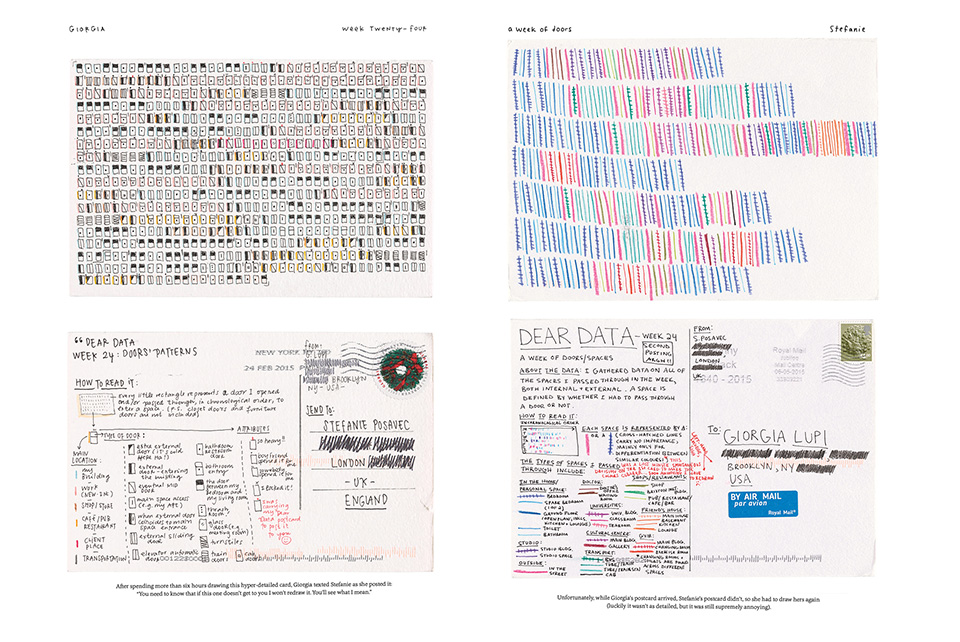
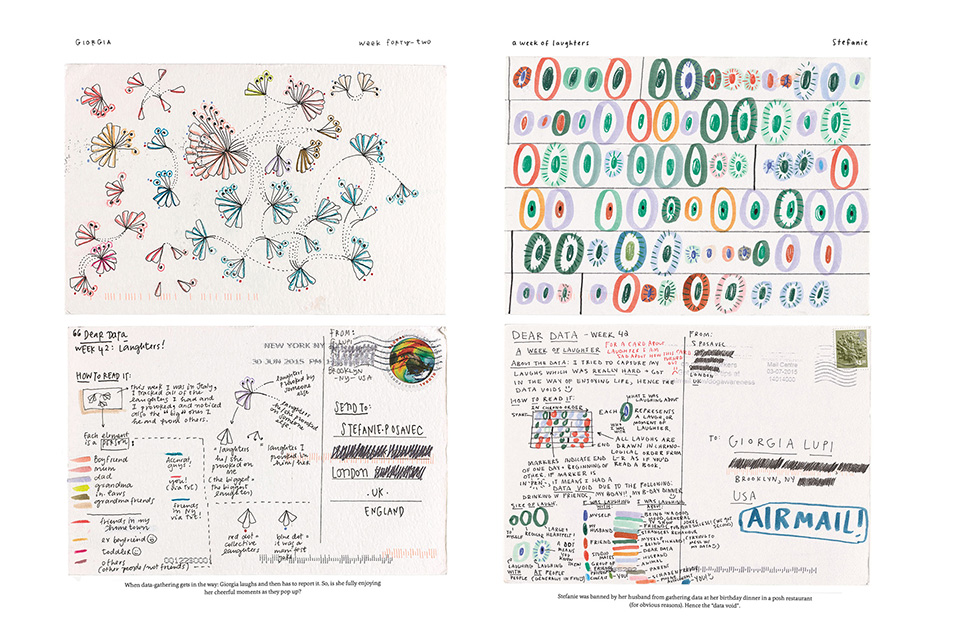
Dear Data — Stefanie Posavec & Giorgia Lupi
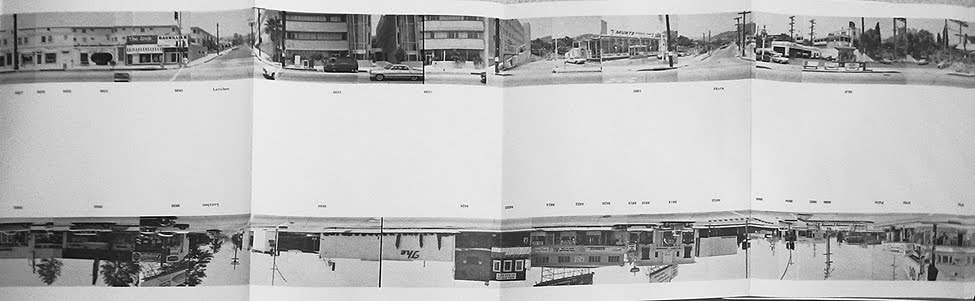
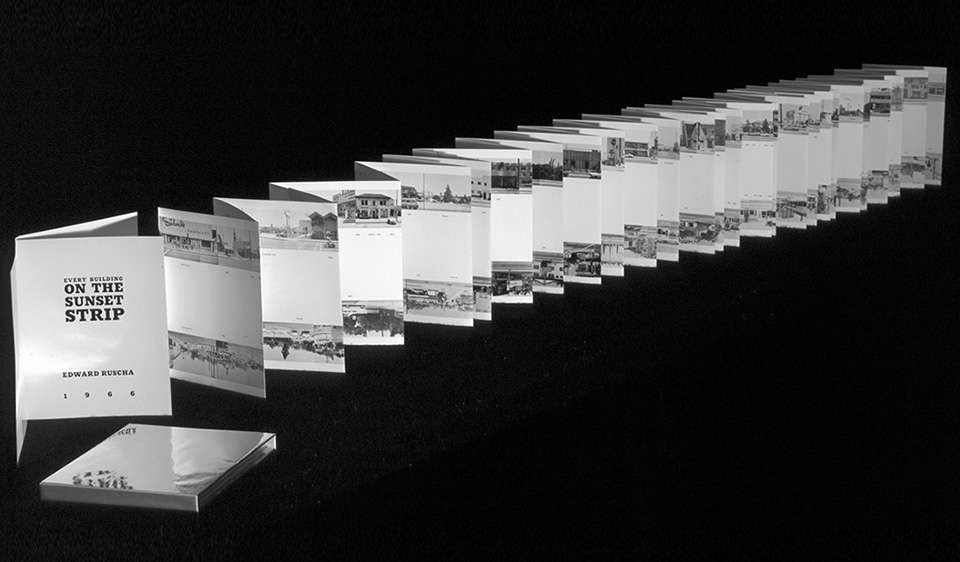
Every Building on the Sunset Strip — Ed Ruscha
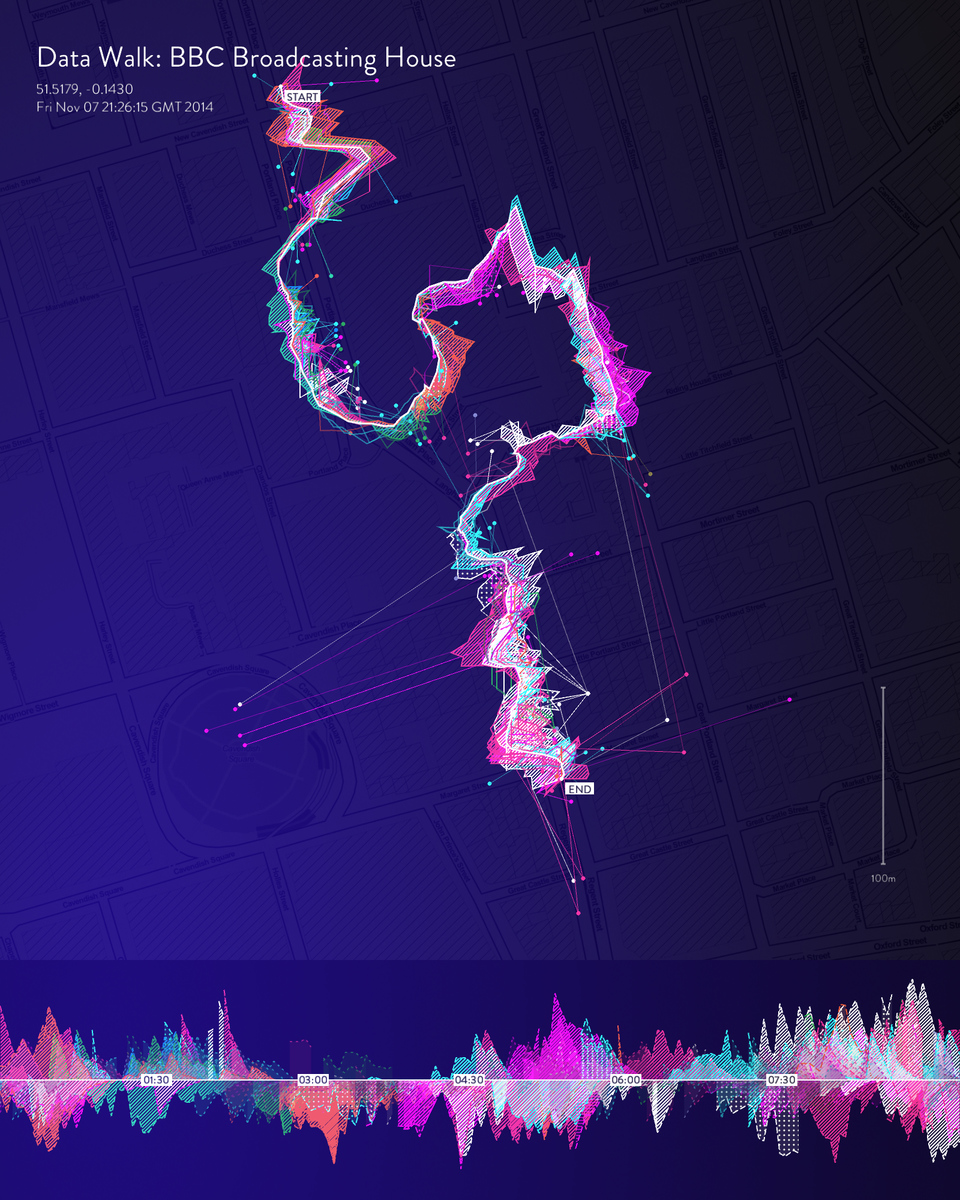
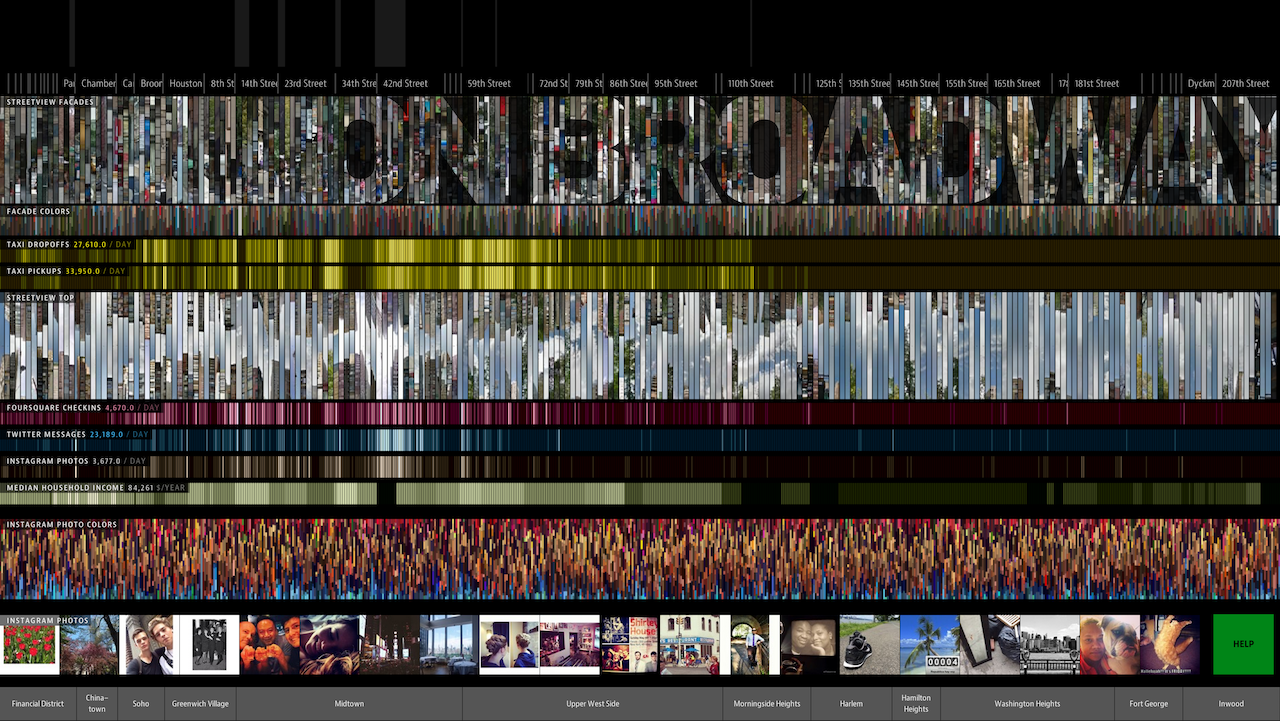
On Broadway — Daniel Goddemeyer, Moritz Stefaner, Dominikus Baur, and Lev Manovich
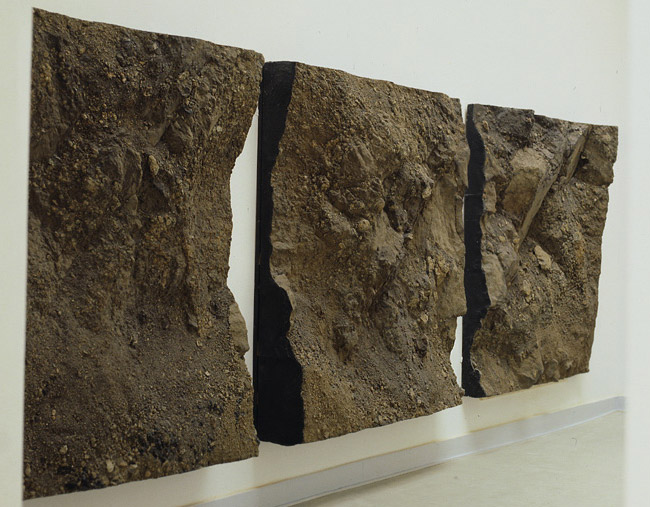
Boyle Family
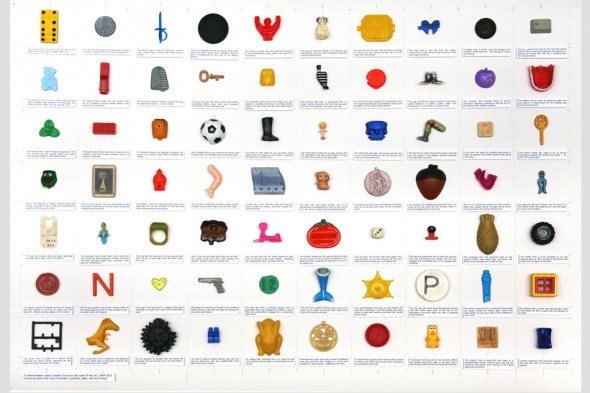
Steve McPherson
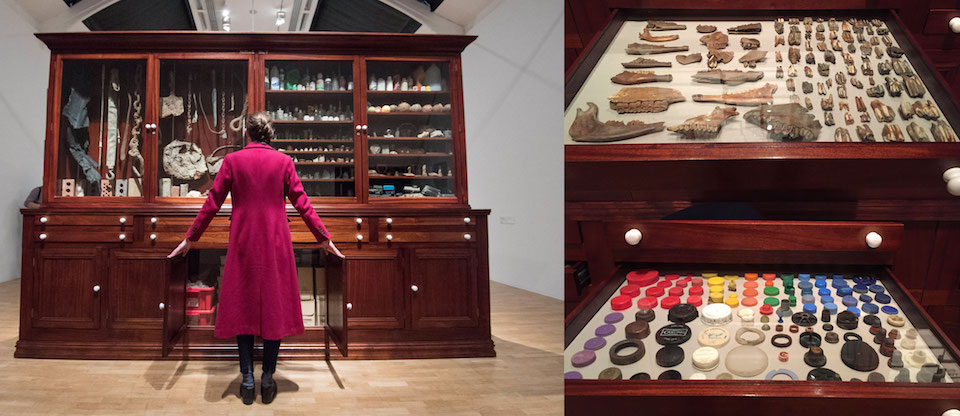
Mark Dion
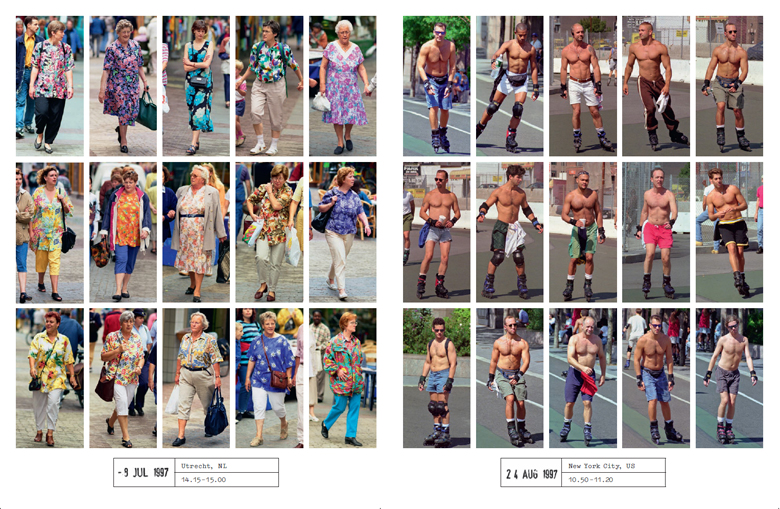
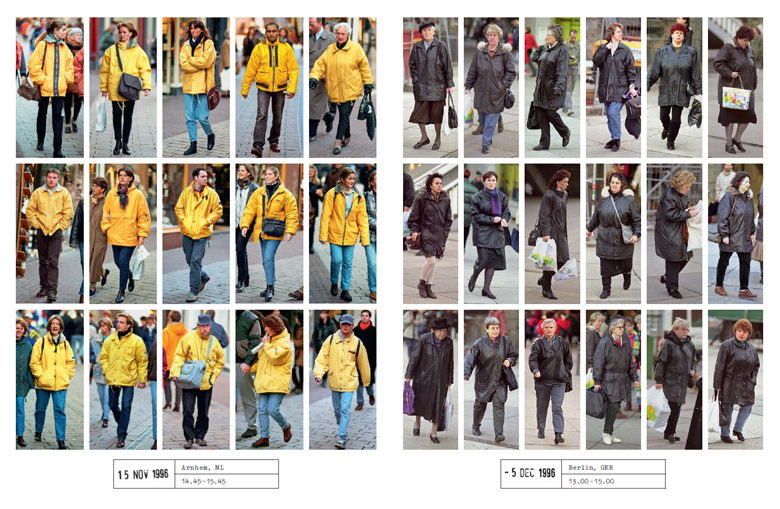
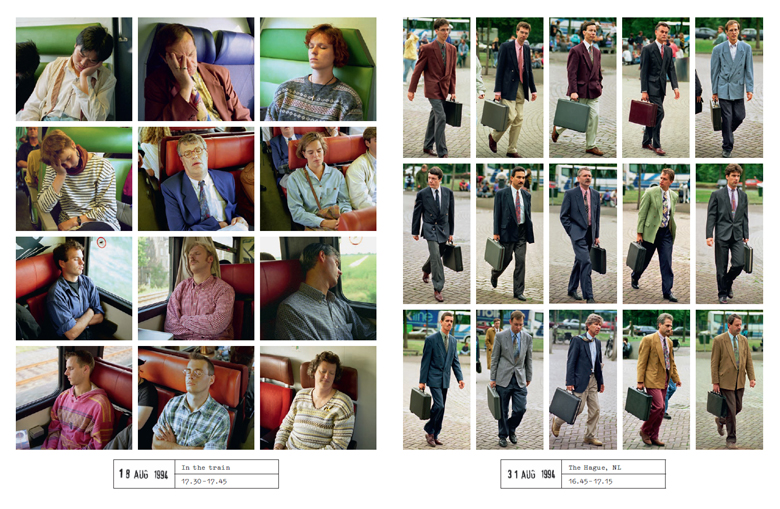
Hans Eijkelboom
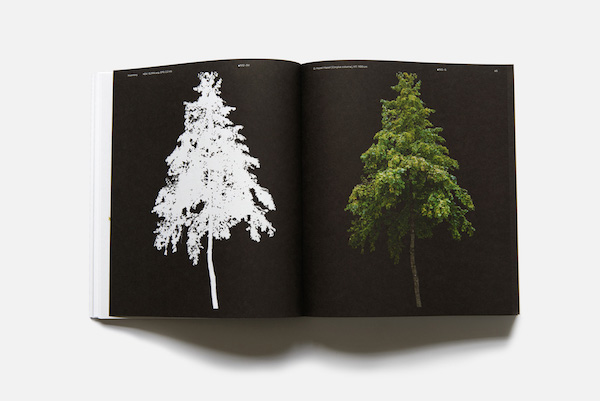
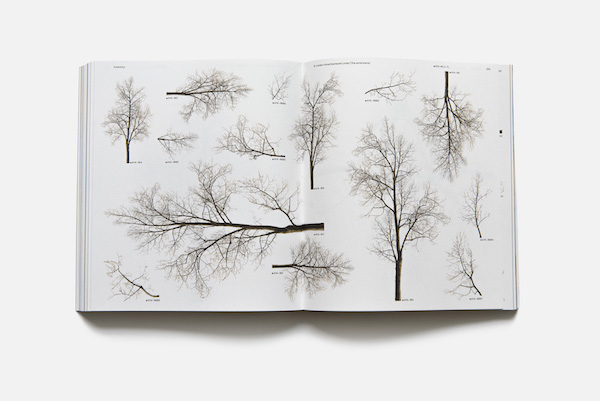
 Neubau Forst — Various
Notice that although these are presented as designed visualisations, almost all of them have gathered their own data.
BRIEF
What can we learn about a place, not just by the quantity of something but the characteristics of that something?
It is not just that there is a lot of litter, but the type of litter that gives us insight into human activity.
- Through photography we can capture those characteristics
- Lets be open to experiment with analog techniques for capture
- Arduino-based data gathering is possible, but requires some programming
- Consitency is key in capturing
CONSIDERATIONS
Consider hyper-focused data gathering vs broad data gathering. With broad gathering (photography) we can target particular variables/trends through visualisation but might lack the necessary detail, with hyper-focused (drawing/notes/sensors) we could miss something that is of greater interest.
When deciding methods and materials, consider if they are appropriate to the theme, consider your expertise level and what you want to gain from the workshop, consider the limited time frame. Personally it has been interesting to move from quantative to qualitive data gathering, using more pictures than numbers as source material.
Each team should decide together what they want to gather data on from the below themes. You may gather data on multiple themes and consider the interrelationship between different aspects.
THEMES
GREEN SPACES
amount, size, characteristics, usage, shadiness, openess
FLORA & FAUNA
amount, size, types, diversity
LITTER
amount, characteristics, litter bins
POLLUTION
air quality (perceived/measured), noise, visual
MESSAGING
amount, characteristics, signage, wayfinding, advertising, posters, flyposting, graffiti
SECURITY
amount, characteristics, cameras, fences, physical control measure, guards, bike locks
VEHICLES
amount, characteristics, type, cars, trucks, motorbikes, bikes, speed, traffic, stationary, parked, interactions, arguments/incidents
PEOPLE
amount, density, characteristics, occupation/usage
ARCHITECTURE
age, style, condition, characteristics, function, usage
CHALLENGE
- What is of interest to you? (themes/techniques?)
- What do you want to know about your area? (specific/generic to a city?)
- What is of value to the people of the area and the authorities?
This workshop can be run in a single day or multiple days; scheduling ideas below.
1 DAY SCHEDULE
DAY 1
1000: Project introduction & workshop briefing
1100: Team forming and theme brainstorming (decide what and how)
1200: Walk and lunch
1300: Check data, evaluate method and results; consider how to create visualisation, sketch
1300: You might want to do a second walk if the data/method/theme/route did not work
1400: Work in your teams to prepare a visualisation of your data/collection
1730: Presentations
1750: Thank you, and time for final questions
2 DAY SCHEDULE
DAY 1
1000: Project introduction & workshop briefing
1100: Team forming and theme brainstorming (decide what and how)
1200: Walk
1300: Lunch
1400: Check data, evaluate method and results; consider how to create visualisation, sketch
1500: Print photos LATCH exercise to order data and make sense of what was collected
1700: Adjust methods, focus of theme, route if necessary. Plan next walk (evening or next day)
DAY 2
1000: Recap
1100: Preparatory work required before another walk
1200: Walk 2 (or at the time you intend)
1300: Lunch
1400: Work in your teams to prepare a visualisation of your data/collection
1730: Presentations
1750: Thank you, and time for final questions
AREA