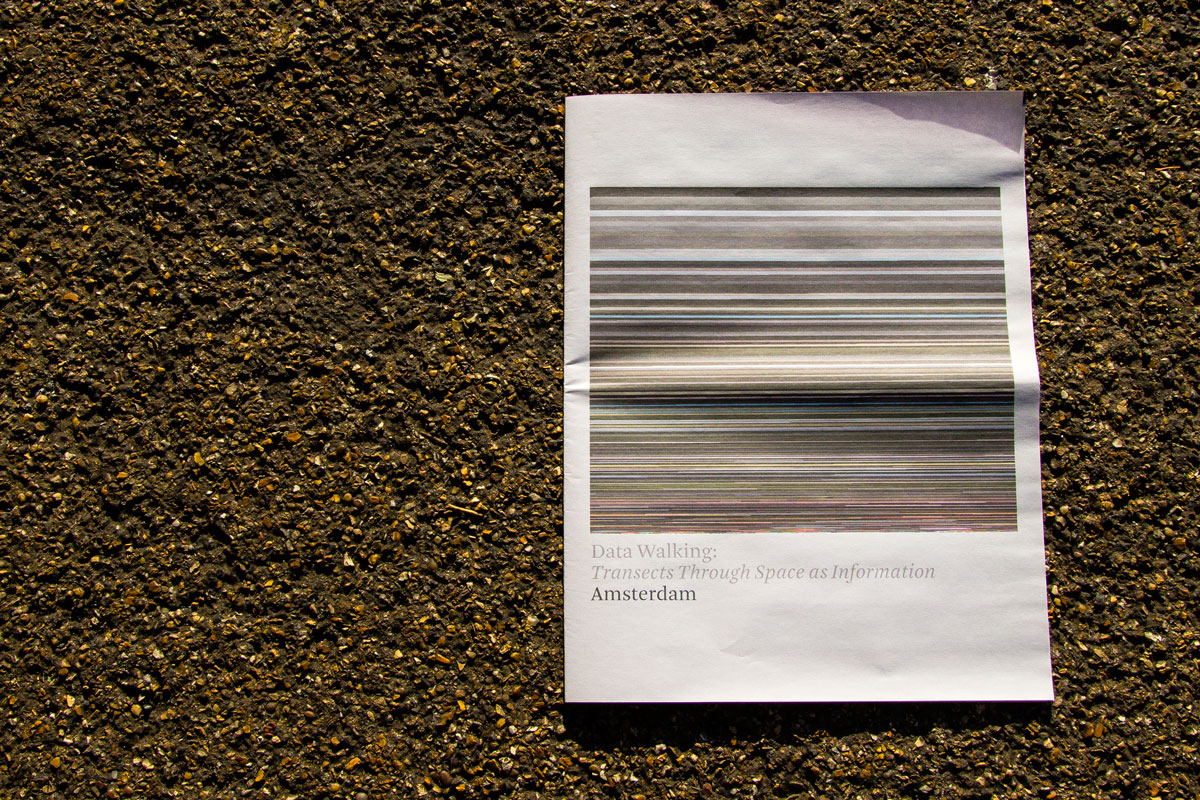
PHASE TWO: AMSTERDAM
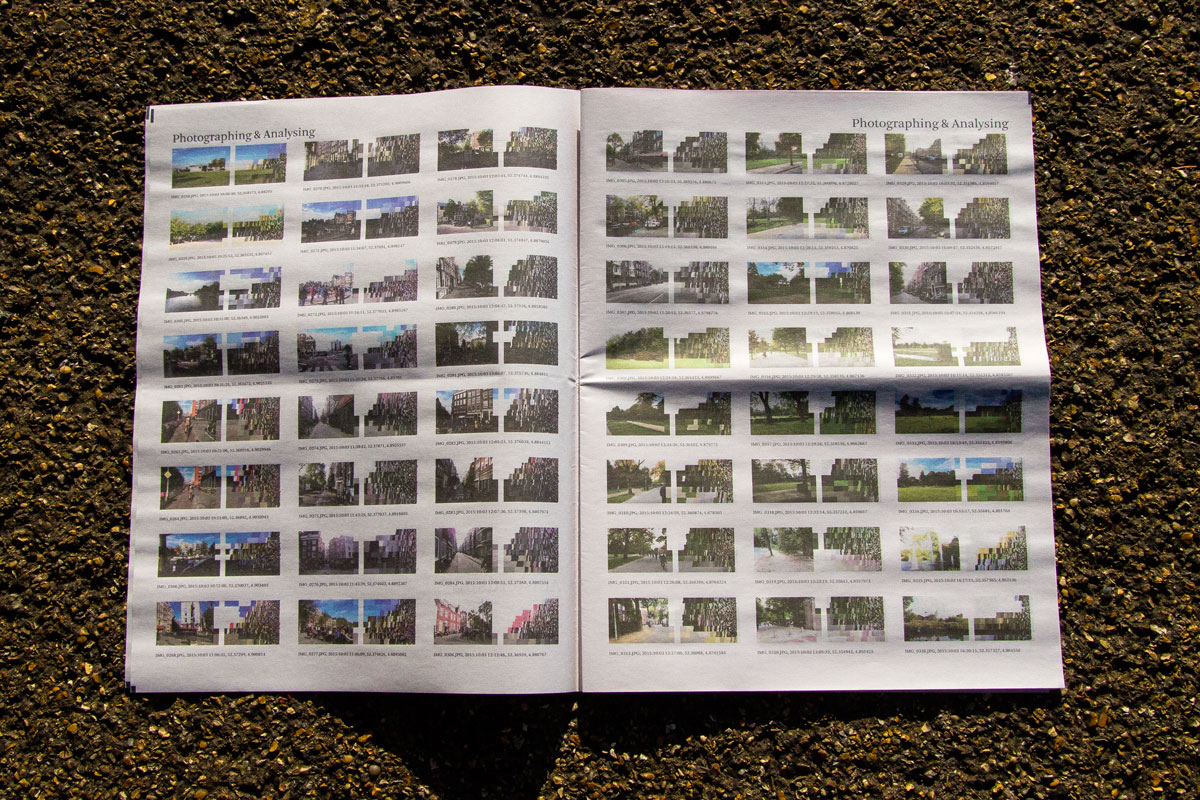
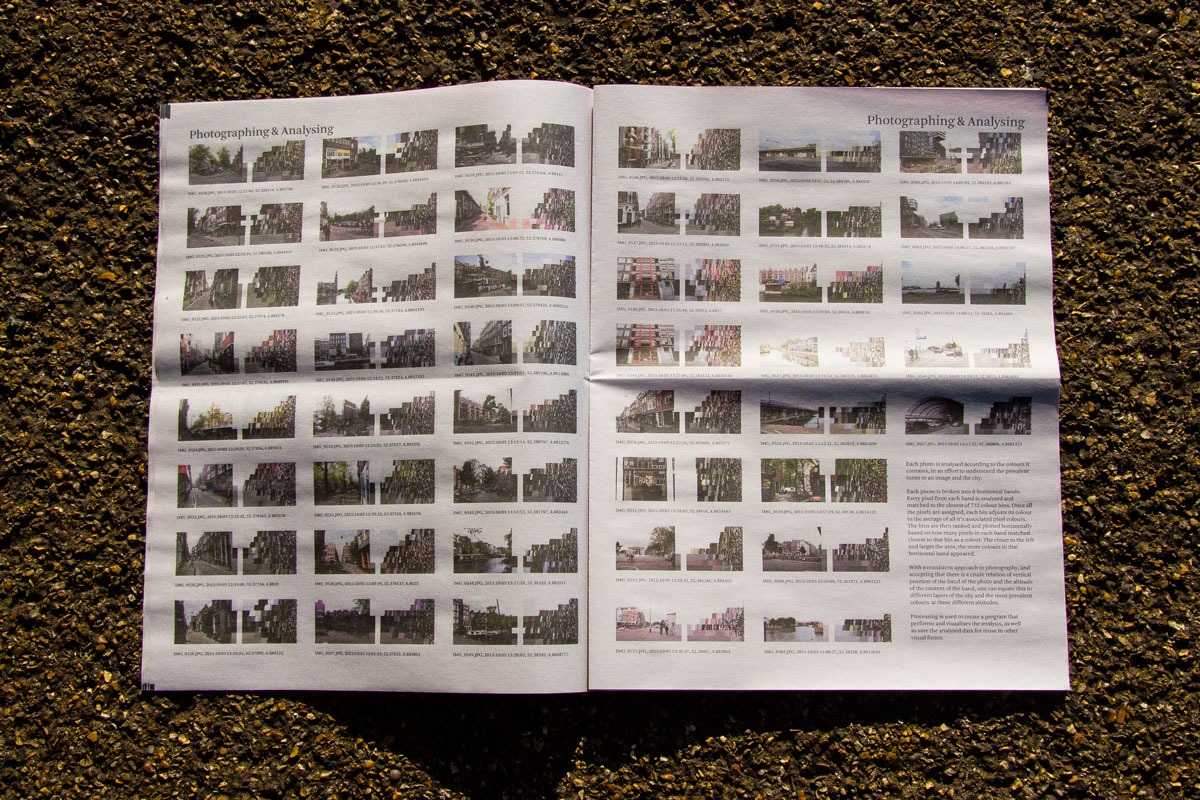
In October 2015, I visited Amsterdam for a weekend. Most of the visit was exploring the many streets and canal sides on foot (with a little cycling) and taking lots of photos.
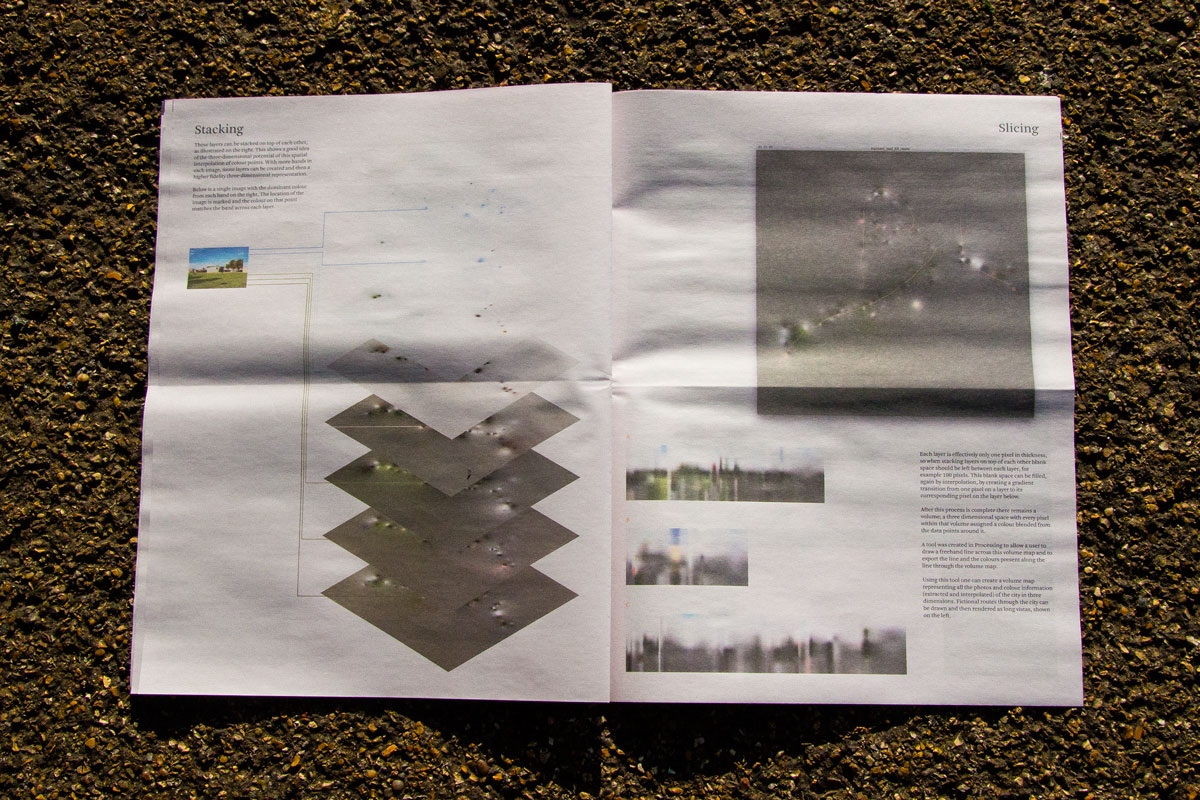
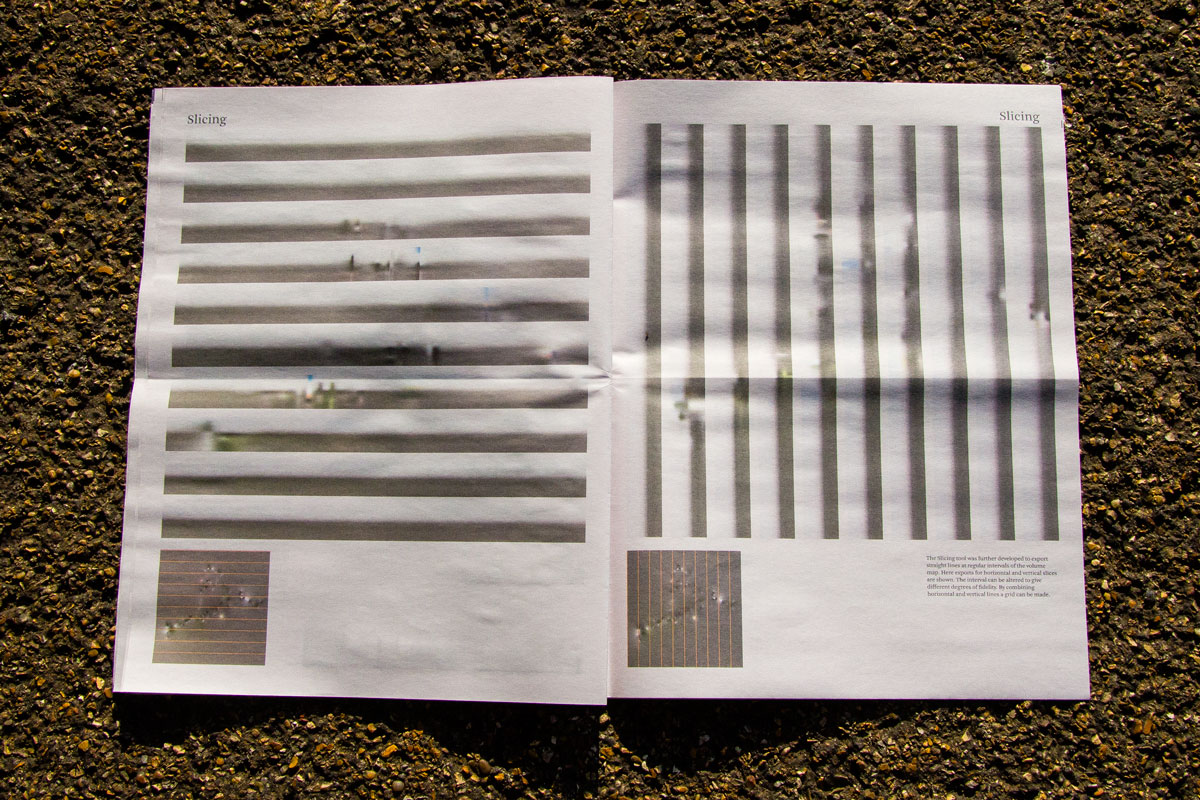
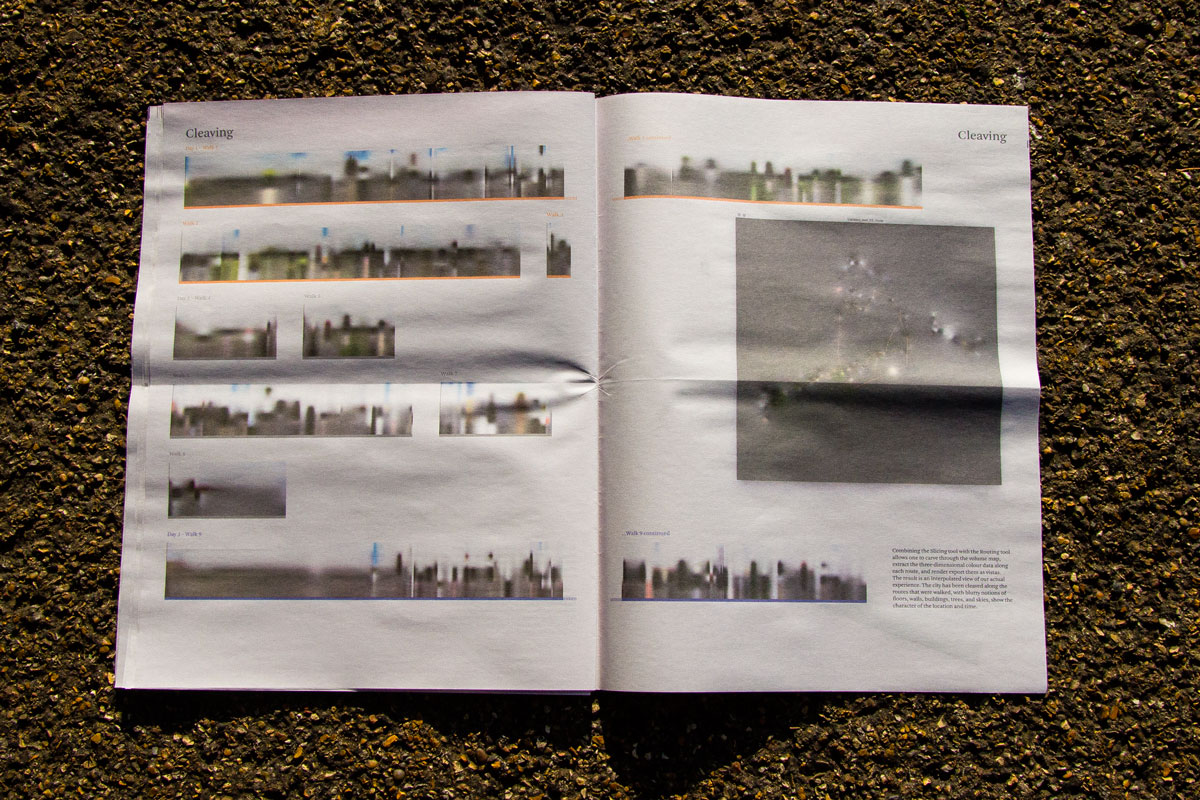
Presented here is an exploration of fulfilling one of the original aims of the Data Walking project: to imagine a city as a three dimensional volume or ‘dataspace’, and be able to cut transects through that city of data.
The tools used were a smartphone with the GPS location accessible to the camera, Open Source programming software Processing, freely available for most operating systems, with the Unfolding Maps library for Processing by Til Nagel, and ExifTool by Phil Harvey. This contrasts with the first and current phases which make use of microcontrollers and environmental sensors to gather data, the idea that even ambient information gathering can yield interesting data.
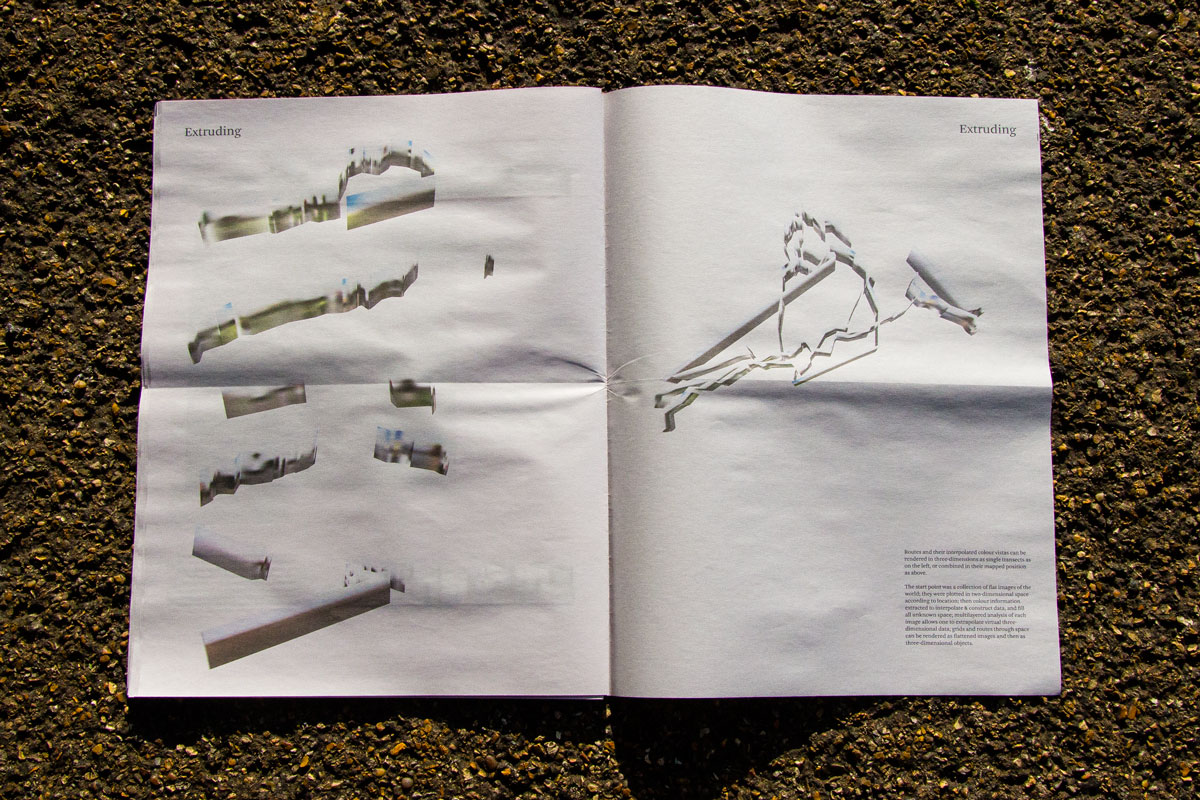
The outcome was a printed publication detailing the process of taking a collection of photos and creating maps, routes, volumes, in 2D and 3D, using computational design methods. Animated transects of travelling through the whole Amsterdam data volume are shown below and were subsequently adapted and displayed as part of Studio Dumbar's DEMO Festival in 2019.
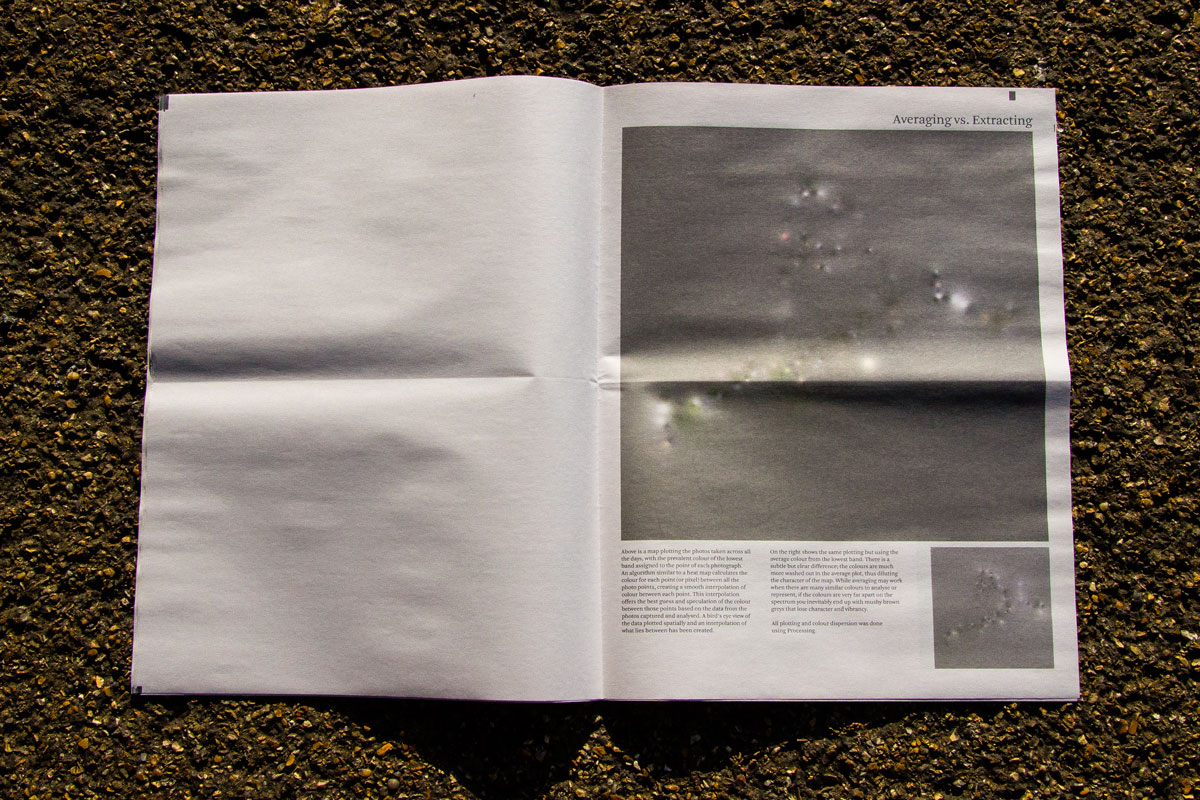
Below is an interactive map which plots all the photos taken and the dominant colour at the base of the photo (effectively the ground), which provides an explorable visualisation of the data used to create the dataspace volumes, transects, and animations.
Data Walking is a research project by David Hunter
Coming out from the process of generating 3D data spaces of Amsterdam with custom data tools to make maps and transects, allowed a new perspective and output to be created from the same dataset and extending the custom tools. Moving transects were created sweeping from the north along a West-East line to the South allowing a view through the city not possible in a single real view and displaying a rhythm, evolution and identity across the city scape. Variations of the below video were then submitted to the Demo Festival in Amsterdam and accepted, displaying with other films across all the public screens in Amsterdam Main Station on continuous rotation for 24 hours.
Data Walking: Amsterdam from David Hunter on Vimeo.