DATA WALKING
A research project exploring data gathering & data visualisation
PHASE THREE: NORTH GREENWICH
In 2016 the Data Walking project was resident in North Greenwich for one year after receiving a major funding grand from the Ravensbourne Research Office. Monthly walks were conducted with participants to gather data, experiment with data gathering techniques and create visualisations with that data. Using sensors to measure noise, air quality, and people were areas of specific interest, as were furthering understanding and developing techniques using smartphones and their images to build custom maps and visualisations.
Before each walk there was be a session to help make different data gathering devices including sensors on micro controllers, smart phones, and hand recorded notes.
Data recorded, photos taken, and tools created with Arduino and Processing were made publicly available through the project github:
github.com/DHDPIC/DATA_WALKING
Participants on the walk included students from a variety of design-based courses at Ravensbourne, a university in North Greenwich. And many more students, educators, and renowned professional designers and studios used the gathered data to create an array of visualisations across different mediums.
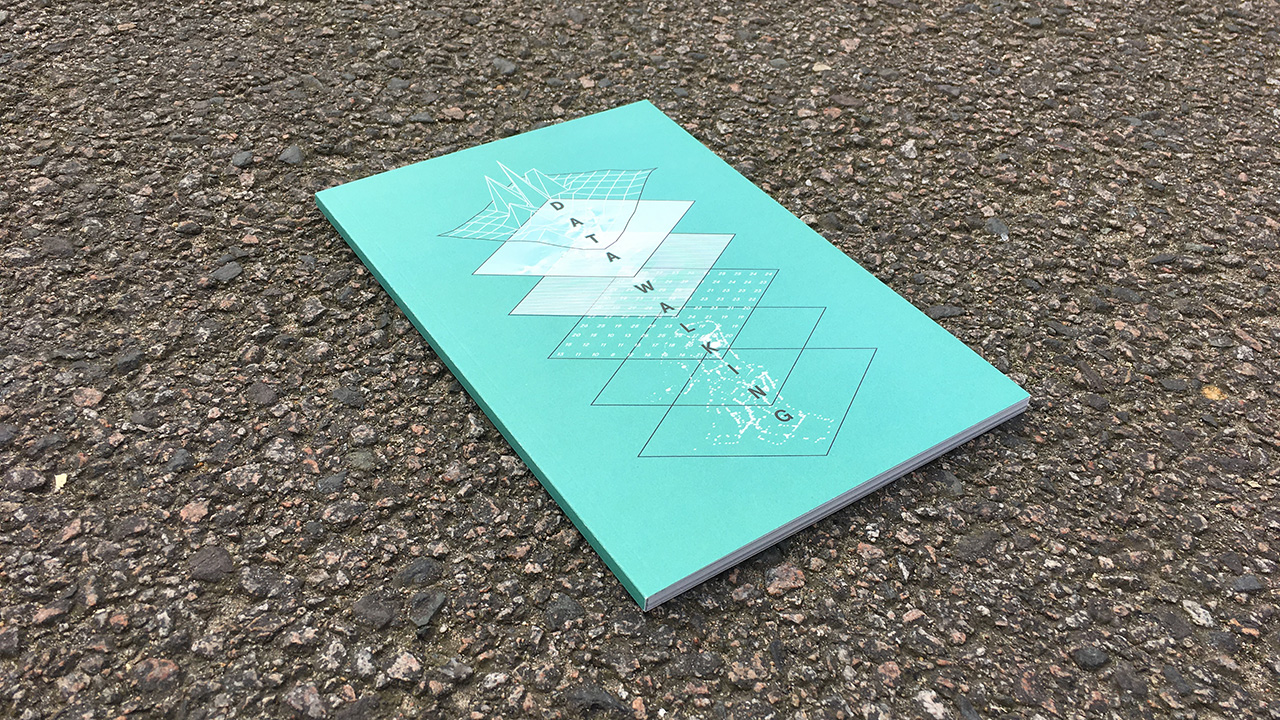 The outcome was a 96 page report, including those contributed visualisations of participants, and some technical advice, exercises and workshops. While the report does not try to be a complete manual or textbook on data walking techniques, it does hope to pull together enough practical resources that it is functional guide to get anyone started doing their own walks.
All printed copies of the report have been given away, but a PDF is available to download now.
CONTRIBUTED VISUALISATIONS & WORKSHOPS
- Erin Browell
- Catalogtree
- Chris Davies
- Brendan Dawes
- Valentina D’Efilippo
- Tyler Field
- Becky Ford
- Calum Hale
- Jack Hubert
- Tom Longmate
- Non-Verbal Club
- Joao Novais
- Evan Raskob
- Luke Rideout
- The Royal Studio
- Callum Stephenson
- Francesco Tacchini
- Tekja
- Maaike van Neck
- Thomas Walskaar
- Nikii Wang
- Piero Zagami
COMPLETED WALK SCHEDULE
27/01/2016
24/02/2016
23/03/2016
20/04/2016
18/05/2016
15/06/2016
28/07/2016
25/08/2016
22/09/2016
20/10/2016
18/11/2016
08/12/2016
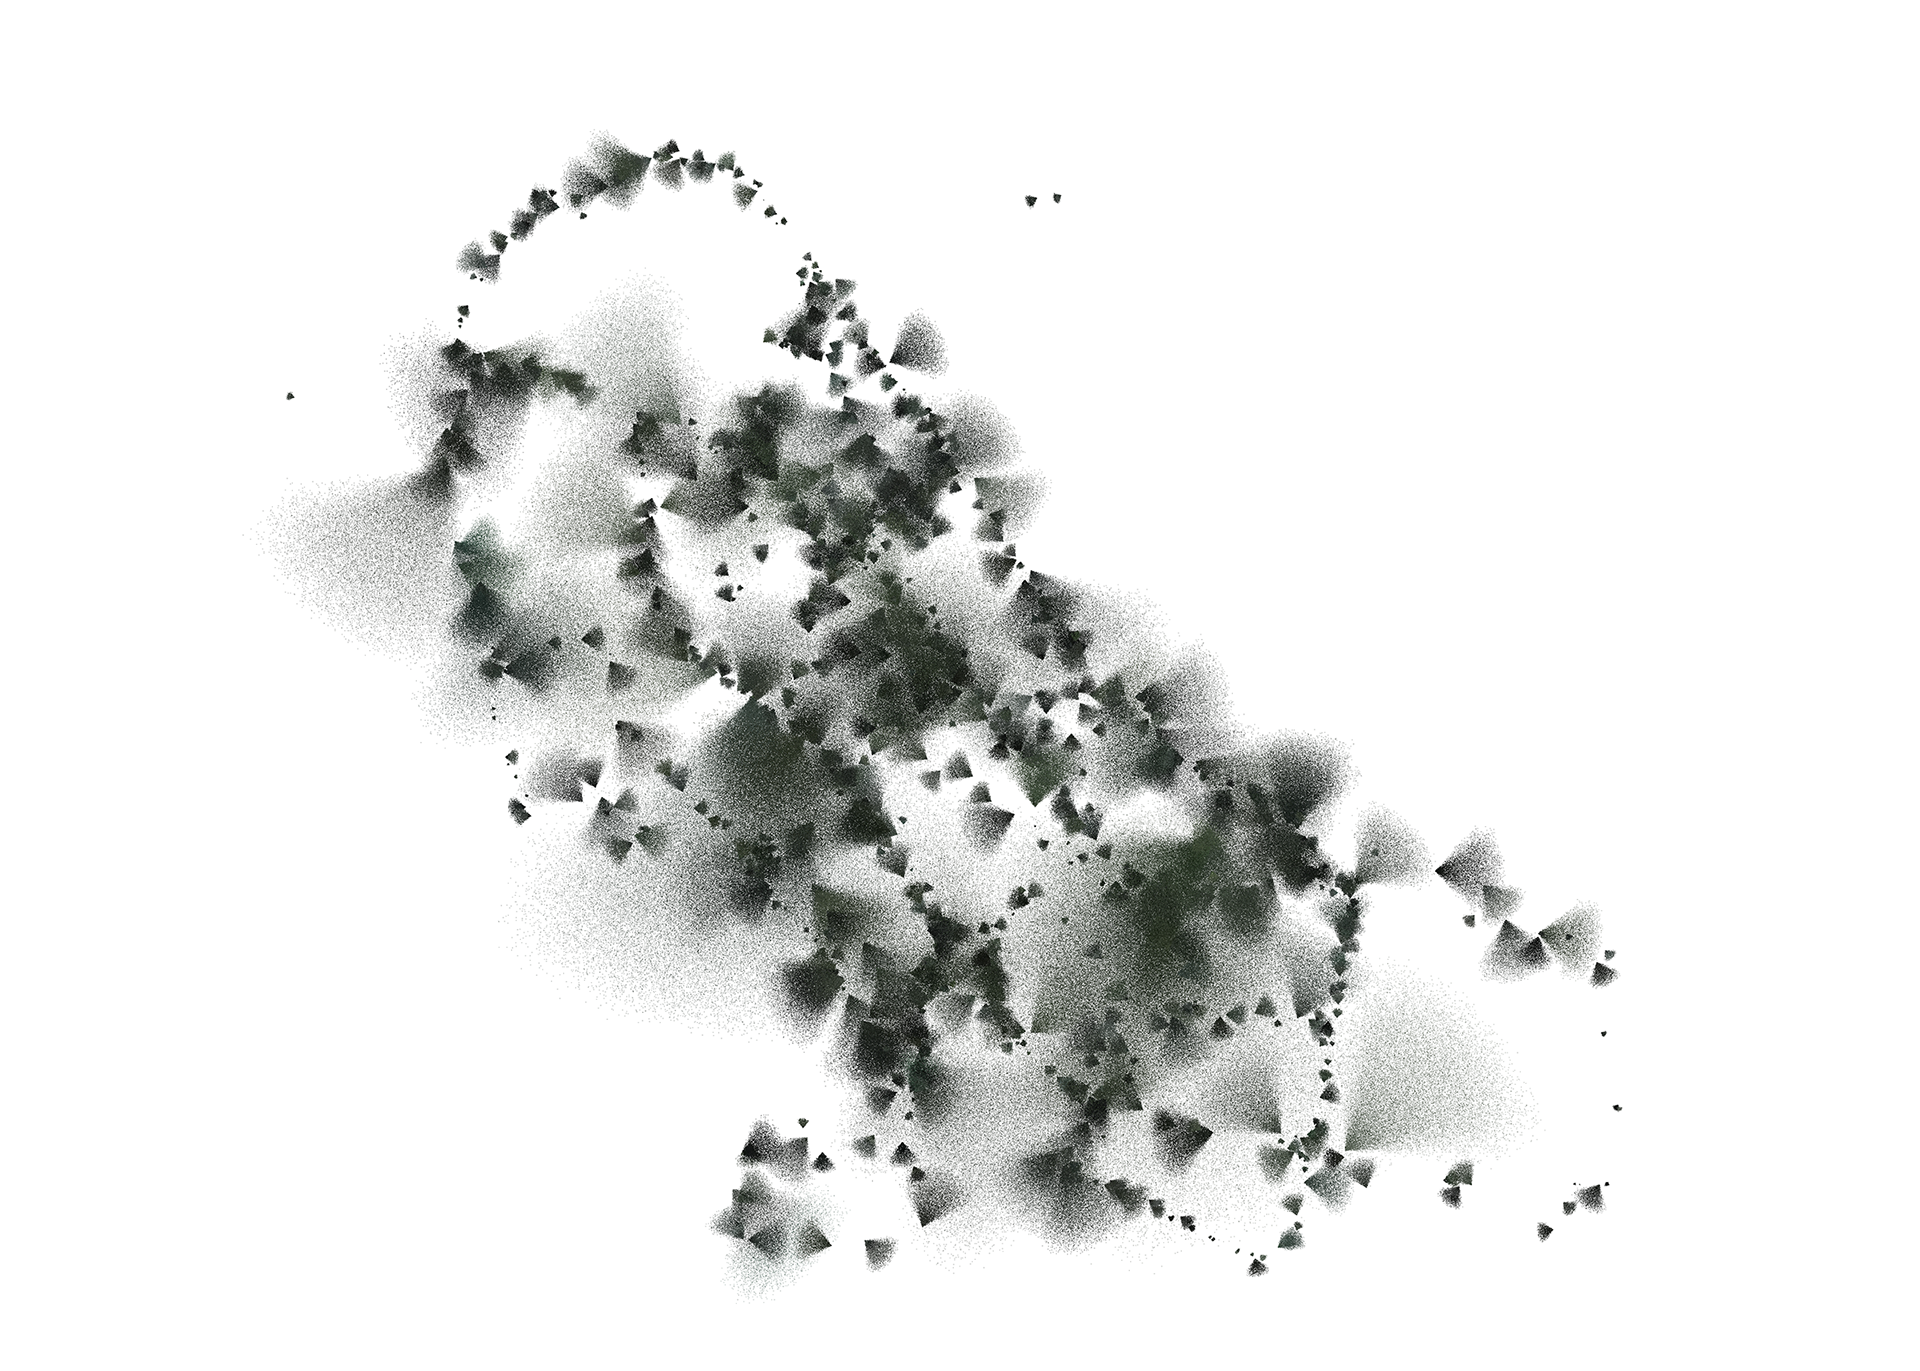
MAP OF ORGANIC GREEN AREAS IN NORTH GREENWICH
This map was included in the Corrupted Files issue #3, the Ravensbourne Contextual Studies publication. It is a map created using over 1000 photos taken on monthly walks around North Greenwich during 2016. The organic green tones are extracted from each photograph and using an algorithm reprojected across the surface of the map in the orientation the photo was taken and the camera angle view. The combination of so many photos from different points and angles highlights areas or vistas that speculate on areas that contain high organic green tones such as parks, trees, shrubbery, fields, forests, and therefore might be desireable to visit.
Data Walking is a research project by David Hunter