PHASE ONE: STRATFORD – BARBICAN
Data Walking began in response to artistic walks conducted by the Mnemonic City collective who used walking to discover and discuss memories and stories of a city. The notion of cities as data rich environments became apparent, and the idea of cutting paths or a transect through this ‘data space’ worth further investigation. Considering the ubiquity of smart phones and low cost micro controllers and environment sensors, a method for data gathering could be established. This technology enables a designer to work end-to-end from data gathering through analysing, editing, authoring and visualising. The act of doing brings about greater insight.
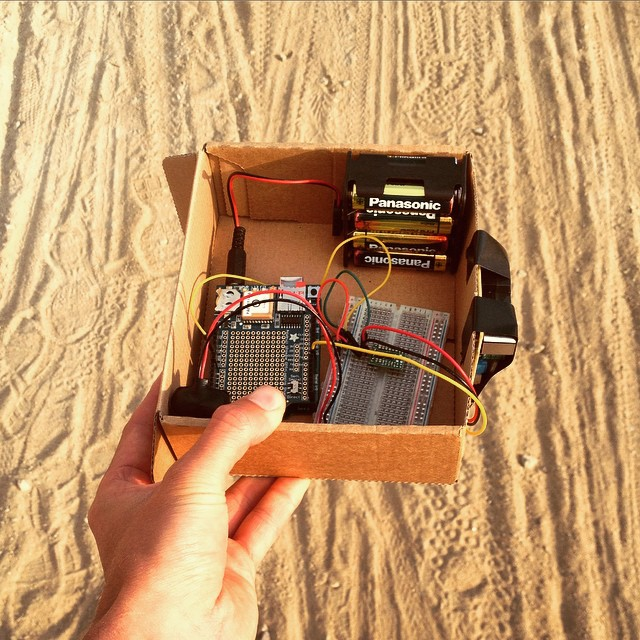
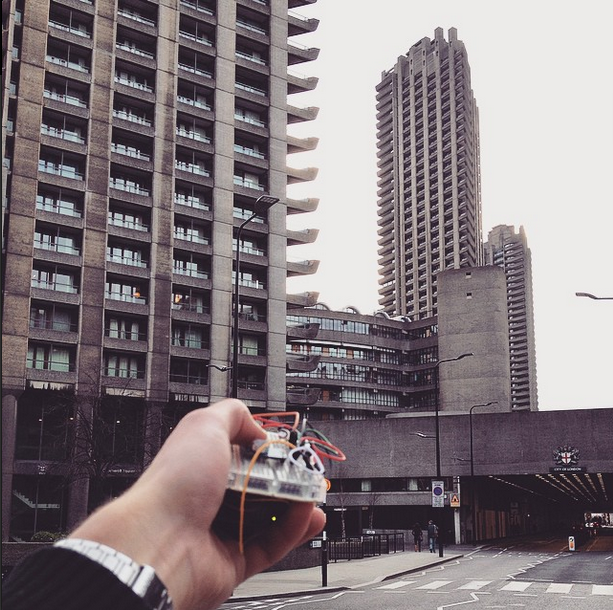
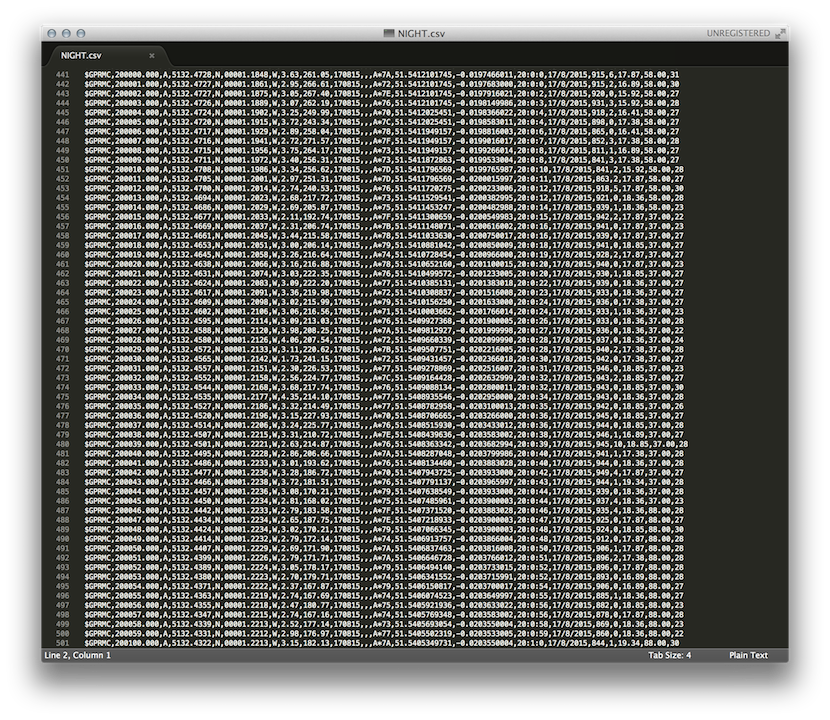
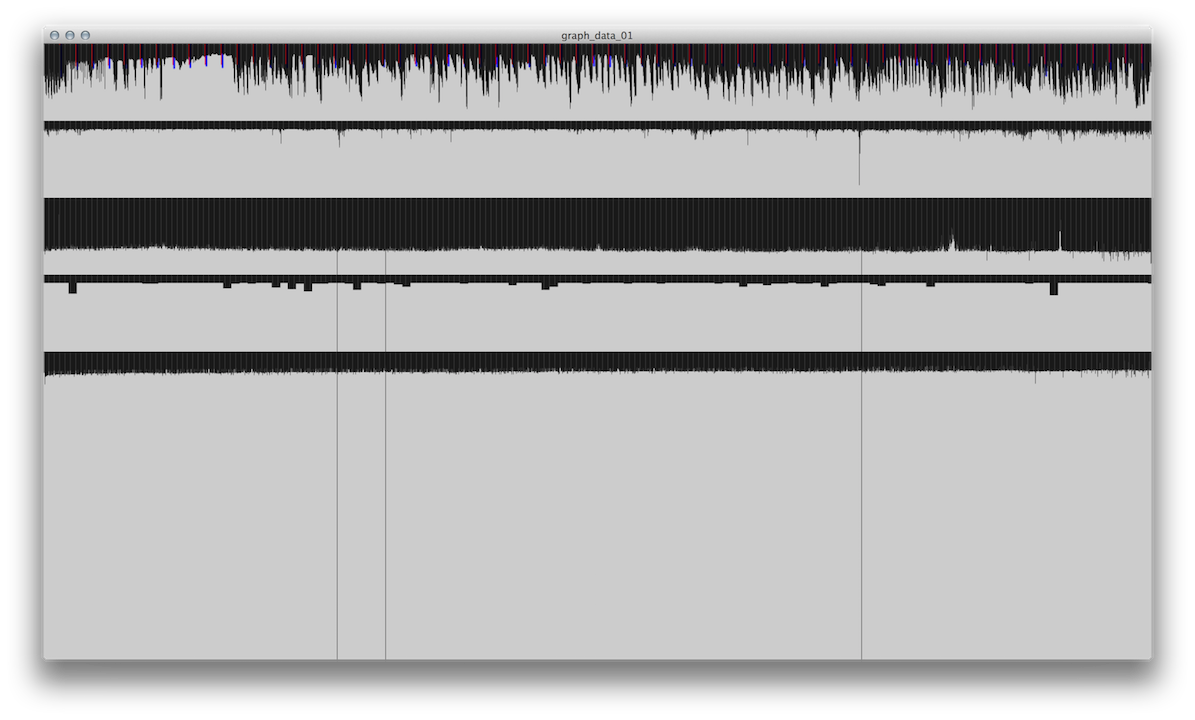
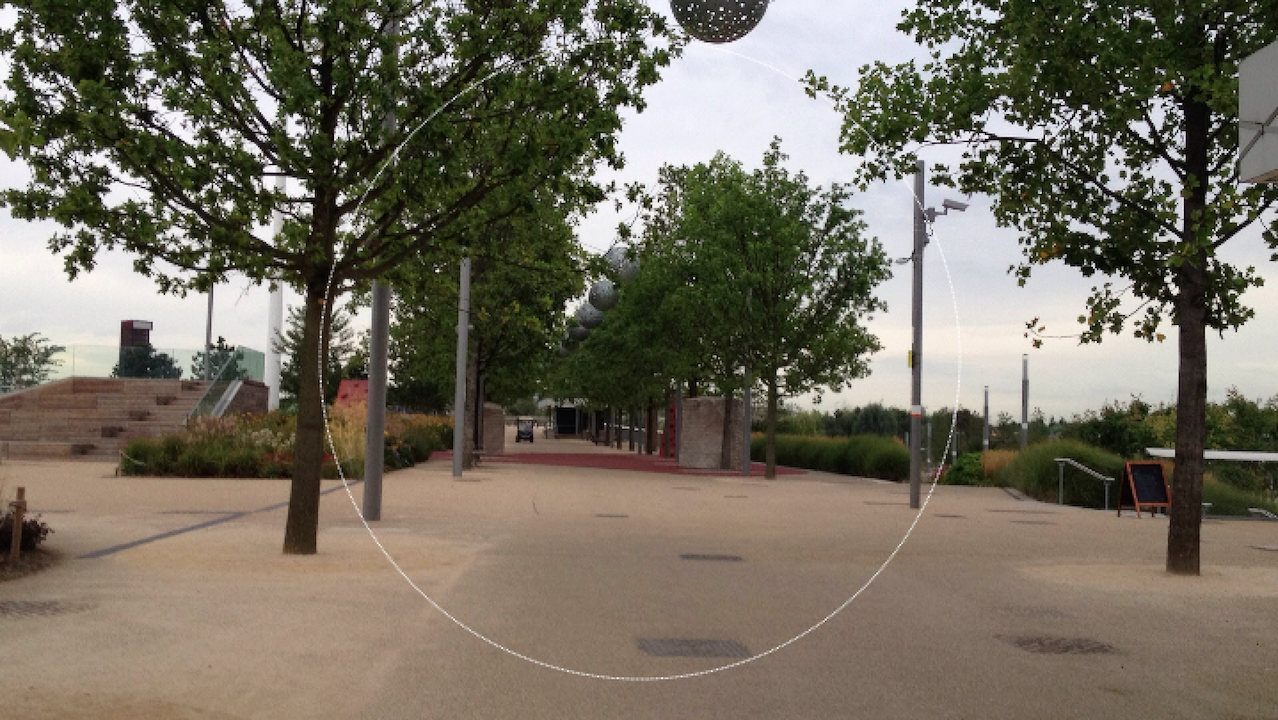
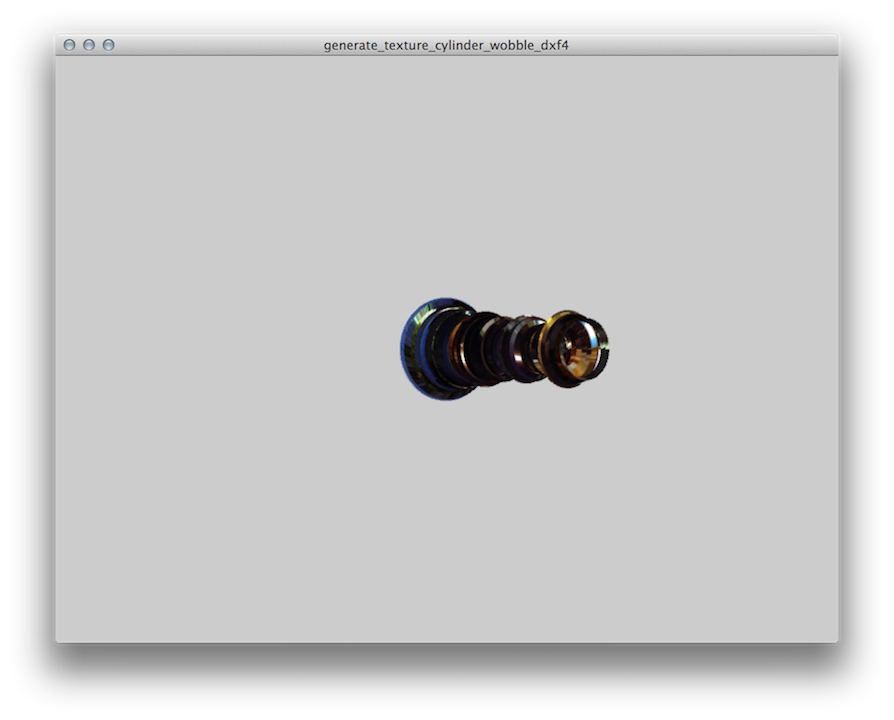
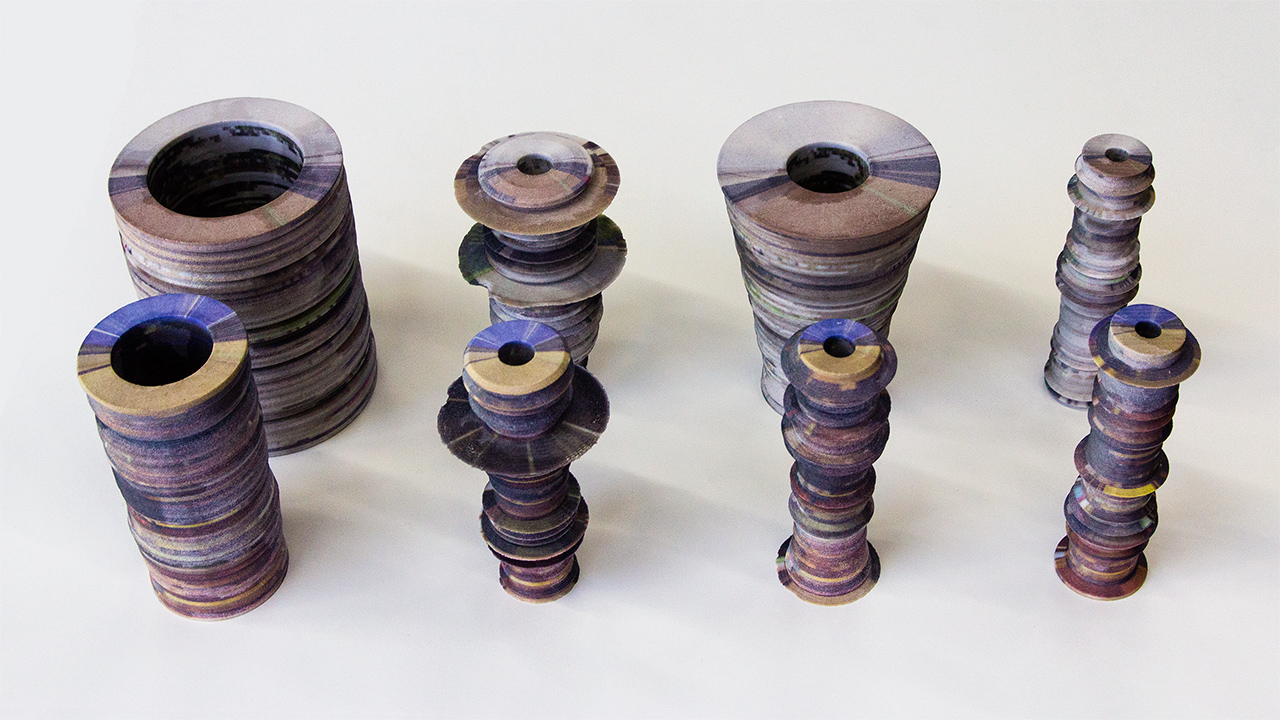
As part of the Fish Island Labs incubator program exhibition Interfaces exhibition, a series of walks were conducted over 24hrs from Stratford (close to the FIL incubator studio) across east London to the Barbican Centre, the exhibition venue. Data was gathered on the environment including light levels, sound, temperature, air quality, as well as photos. The outcome was a series of 3D printed data cylinders encoding each data type recorded and mapped to the photo taken in that location. Images of the cylinders can be seen below, along with process shots.
This phase of the Data Walking research project was funded by the Ravensbourne Research Office and Barbican Centre. Data Walking is a research project by David Hunter.
DATA CYLINDERS
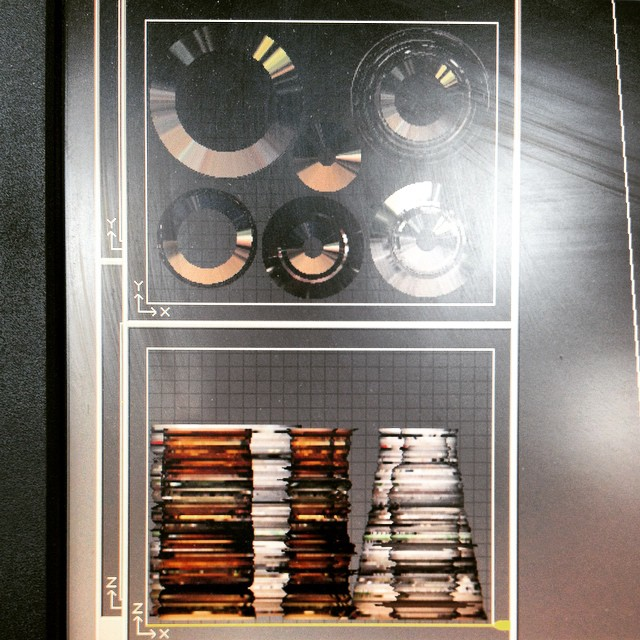
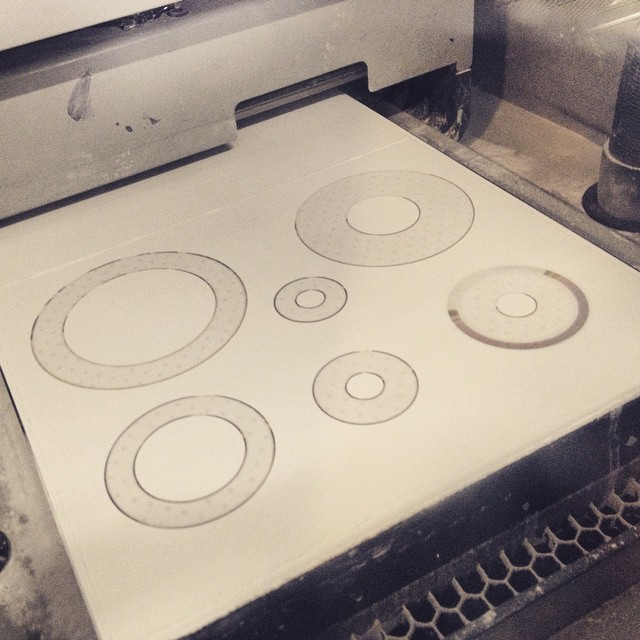
PROCESS